📚 Table of Contents
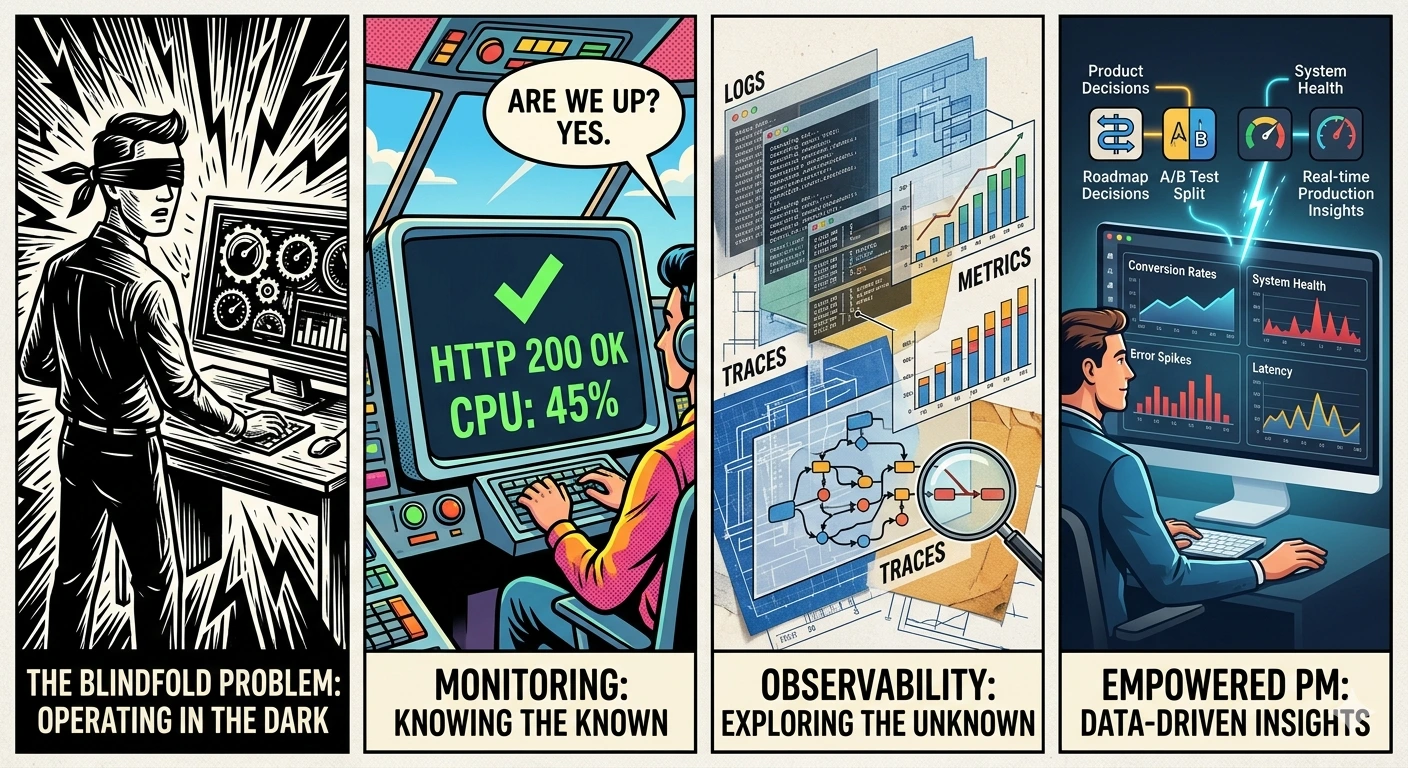
- The Blindfold Problem: When You Don’t Know What’s Happening
- Monitoring vs. Observability: The Real Difference
- The Three Pillars of Observability (Simplified)
- What PMs Actually Need from Monitoring
- SLI, SLO, SLA: The Alphabet Soup That Actually Matters
- The Dashboards You Should Request
- Alert Fatigue: The Hidden Productivity Killer
- Making Product Decisions with Production Data
- Questions to Ask Your Engineering Team
- The Business Case for Observability Investment
- Getting Started: The PM’s Observability Checklist
- Common Mistakes and How to Avoid Them
- The Bottom Line
The Blindfold Problem: When You Don’t Know What’s Happening
Picture this: It’s 2 PM on a Tuesday. You’re in a product review meeting, presenting last week’s feature launch. An executive asks a simple question:
“How’s the new checkout flow performing?”
You freeze. Because you don’t actually know.
Sure, you can pull up Google Analytics and see conversion rates. But that’s lagging data—yesterday’s users. What’s happening right now? Are users experiencing errors? Is the page loading slowly for some users? Did something break in the last hour?
You can’t answer any of these questions.
Meanwhile, your engineering team is in a separate war room, debugging a production issue that’s been going on for three hours. Users have been seeing error messages, but nobody told you. Customer support is overwhelmed, but they haven’t escalated to product yet.
This is the blindfold problem: You’re making product decisions without knowing what’s actually happening in your system.
I’ve been there. Most PMs have. We focus on roadmaps, user research, and feature specs—but we’re blind to the reality of what’s happening in production.
The solution: Understanding monitoring and observability isn’t optional for PMs anymore. It’s how you know if your product actually works.
Monitoring vs. Observability: The Real Difference
Let’s clear up the jargon.
Monitoring: “Is It Working?”
Monitoring is like the dashboard in your car. It tells you:
- Speed? ✓
- Fuel level? ✓
- Engine temperature? ✓
- Check engine light on? ✓
Monitoring answers: “Is the system healthy?”
It tells you when something is wrong. But not necessarily why.
Examples of monitoring:
- CPU usage is at 85%
- Response time is 450ms
- Error rate is 2%
- Database has 500 connections
These are known-knowns. You know what to measure, you measure it, and you know when it’s wrong.
Observability: “Why Isn’t It Working?”
Observability is like having a mechanic who can diagnose any problem by looking at the engine while you drive.
Observability answers: “Why is the system behaving this way?”
It lets you investigate problems you didn’t anticipate.
Examples of observability:
- “Why is user John getting a 500 error on checkout?” (Traces)
- “What happened in the system when latency spiked at 2 PM?” (Logs + Traces)
- “Which API call is causing the payment failures?” (Distributed tracing)
These are unknown-unknowns. You didn’t know to look for this problem, but observability lets you investigate it.
The Practical Difference for PMs
| Monitoring | Observability |
|---|---|
| Alerts you when something breaks | Helps you understand WHY it broke |
| Predefined dashboards and alerts | Ad-hoc investigation capability |
| “Error rate is 5%” | “Error rate is 5% because the payment API timeout increased” |
| Reactive (something happened) | Proactive (understanding patterns) |
| What you measure | What you can learn |
You need both. Monitoring tells you there’s a problem. Observability helps you fix it.
The Three Pillars of Observability (Simplified)
Engineers talk about “the three pillars of observability.” Here’s what they actually mean, in PM terms:
Pillar 1: Metrics (The Numbers)
What they are: Numerical measurements over time.
Analogy: The dashboard in your car—speedometer, fuel gauge, temperature.
Examples:
- Requests per second: 1,247
- Error rate: 1.3%
- Average response time: 234ms
- Active users: 4,521
- Database queries per second: 8,432
What PMs need to know:
- Metrics are great for dashboards and alerts
- They tell you the what, not the why
- You can trend them over time to see patterns
- They’re the foundation of SLIs (more on that later)
Tools: Prometheus, Datadog, New Relic, CloudWatch
Pillar 2: Logs (The Story)
What they are: Text records of events that happened.
Analogy: A ship captain’s log—recording everything that happened, when, and details.
Examples:
2025-12-12 14:23:45 ERROR user_id=12345 action=checkout error="Payment declined"
2025-12-12 14:23:46 WARN  api=stripe response_time=3500ms timeout=true
2025-12-12 14:23:47 INFO  user_id=12345 action=checkout_retry attempt=2
What PMs need to know:
- Logs tell the story of what happened
- They’re searchable—find all errors for a specific user
- They’re essential for debugging
- But they can be overwhelming (millions of lines)
Tools: ELK Stack (Elasticsearch, Logstash, Kibana), Splunk, Datadog Logs, CloudWatch Logs
Pillar 3: Traces (The Map)
What they are: A record of a single request’s journey through your system.
Analogy: GPS tracking a delivery truck’s route—where did it go, how long at each stop.
Example:
User clicks "Checkout" (0ms)
    ├── Load user cart (23ms)
    ├── Validate inventory (45ms)
    ├── Calculate shipping (12ms)
    ├── Process payment (2340ms) ← SLOW!
    │       ├── Call Stripe API (2200ms) ← Bottleneck!
    │       ├── Update order DB (89ms)
    │       └── Send confirmation email (45ms)
    └── Return confirmation (2385ms total)
What PMs need to know:
- Traces show you where time is spent
- They reveal bottlenecks
- They’re essential for microservices (where a request touches many services)
- They help answer “why is this slow?”
Tools: Jaeger, Zipkin, Datadog APM, New Relic, Honeycomb
How They Work Together
Problem detected → Check METRICS (what's wrong?)
                 → Check LOGS (what happened?)
                 → Check TRACES (where did it happen?)
                 → Fix the problem
What PMs Actually Need from Monitoring
You don’t need to understand every technical detail. But you need to know what to ask for.
The Four Categories of Metrics That Matter
1. User Experience Metrics
These tell you if users are having a good experience:
| Metric | What It Means | Target |
|---|---|---|
| P95 Latency | 95% of requests are faster than this | <500ms |
| Error Rate | % of requests that fail | <1% |
| Availability | % of time the system is up | >99.9% |
| Page Load Time | How fast pages render | <3 seconds |
2. Business Metrics
These connect system performance to business outcomes:
| Metric | What It Means | Why It Matters |
|---|---|---|
| Conversion Rate | % of users who complete key action | Revenue impact |
| Cart Abandonment | % who start checkout but don’t finish | Friction indicator |
| Feature Adoption | % using new features | Product-market fit |
| Support Tickets | Number of user complaints | User pain |
3. System Health Metrics
These tell you if the system is stable:
| Metric | What It Means | Red Flag |
|---|---|---|
| CPU Usage | Server processing load | >80% sustained |
| Memory Usage | RAM consumption | >85% |
| Database Connections | Active DB connections | Near limit |
| Queue Depth | Waiting jobs | Growing over time |
4. Team Velocity Metrics
These tell you if the team can ship:
| Metric | What It Means | Target |
|---|---|---|
| Deployment Frequency | How often you ship | Multiple/week |
| Lead Time | Idea to production | <1 week |
| Mean Time to Recovery | How fast you fix issues | <1 hour |
| Change Failure Rate | % of deploys that break things | <15% |
SLI, SLO, SLA: The Alphabet Soup That Actually Matters
These three acronyms are the foundation of reliability measurement. Here’s what they mean:
SLI: Service Level Indicator
The metric you measure. What defines “good” for your service?
Examples:
- Availability: 99.95% of requests succeeded
- Latency: 95% of requests completed in <200ms
- Error rate: <0.1% of requests resulted in errors
PM Perspective: SLIs are the metrics that matter to users. Not CPU usage, but user experience.
SLO: Service Level Objective
The target you set. What’s your goal for the SLI?
Examples:
- Availability SLO: 99.9% uptime per month
- Latency SLO: 95% of requests <200ms
- Error SLO: <0.1% error rate
PM Perspective: SLOs are commitments. When you miss an SLO, users are unhappy. Track SLOs in your product reviews.
SLA: Service Level Agreement
The contractual commitment. What happens if you miss the target?
Examples:
- If uptime < 99.9%, we refund 10% of monthly fee
- If response time > 500ms for >1 hour, we credit account
PM Perspective: SLAs are business contracts. They have financial consequences. Know what your SLAs are, and ensure your SLOs are better than your SLAs.
The Relationship
SLA (Contract: 99.9% uptime or we pay)
    ↑ Must be better than
SLO (Target: 99.95% uptime)
    ↑ Is measured by
SLI (Metric: Actual uptime = 99.97%)
The Error Budget: The gap between SLO and reality.
If your SLO is 99.9% uptime, you have 43.8 minutes of downtime allowed per month. That’s your error budget.
- Burn budget slowly = system is healthy
- Burn budget quickly = something is wrong
- No budget left = stop shipping features, fix reliability
The Dashboards You Should Request
You shouldn’t build these dashboards yourself. But you should request them from your engineering team.
Dashboard 1: Executive Summary
Audience: You, executives, stakeholders
Refresh: Real-time
Purpose: Quick health check
┌─────────────────────────────────────────────────────────────┐
│ PRODUCT HEALTH - Executive Dashboard                         │
├─────────────────────────────────────────────────────────────┤
│                                                              │
│  Availability     Error Rate      Latency P95    Users      │
│  ┌─────────────┐ ┌─────────────┐ ┌─────────────┐ ┌────────┐ │
│  │   99.94%    │ │    0.3%     │ │   234ms     │ │ 4,521  │ │
│  │   ✓ GOOD    │ │   ✓ GOOD    │ │   ✓ GOOD    │ │ ↑ +12% │ │
│  └─────────────┘ └─────────────┘ └─────────────┘ └────────┘ │
│                                                              │
│  Current Sprint Features                                     │
│  ├── New Checkout:     ON TRACK (0.2% errors)               │
│  ├── User Dashboard:   ON TRACK (converting +5%)            │
│  └── Mobile App:       WARNING (latency +200ms)             │
│                                                              │
│  Active Incidents: NONE                                      │
│                                                              │
└─────────────────────────────────────────────────────────────┘
Dashboard 2: Feature Performance
Audience: You, engineering lead
Refresh: Real-time
Purpose: Monitor specific features
┌─────────────────────────────────────────────────────────────┐
│ FEATURE: New Checkout Flow                                   │
├─────────────────────────────────────────────────────────────┤
│                                                              │
│  Rollout: 75% of users                                       │
│                                                              │
│  Key Metrics (Last 24h):                                     │
│  ├── Conversion Rate:    3.2% (+0.5% vs old)                │
│  ├── Error Rate:         0.4% (target: <1%)                 │
│  ├── Avg Completion:     45 seconds (old: 62 seconds)       │
│  └── Cart Abandonment:   18% (old: 24%)                     │
│                                                              │
│  Top Errors:                                                 │
│  1. Payment timeout (23 occurrences)                        │
│  2. Address validation (12 occurrences)                     │
│                                                              │
│  User Feedback Score: 4.2/5.0                               │
│                                                              │
└─────────────────────────────────────────────────────────────┘
Dashboard 3: Error Budget Tracker
Audience: You, engineering, stakeholders
Refresh: Daily
Purpose: Reliability planning
┌─────────────────────────────────────────────────────────────┐
│ ERROR BUDGET - December 2025                                 │
├─────────────────────────────────────────────────────────────┤
│                                                              │
│  SLO Target: 99.9% uptime                                    │
│  Budget: 43.8 minutes of downtime allowed                    │
│                                                              │
│  Current Status:                                             │
│  ├── Budget Used:    12.3 minutes (28%)                     │
│  ├── Budget Remaining: 31.5 minutes (72%)                   │
│  └── Days Left:      19 days                                │
│                                                              │
│  Status: ✓ HEALTHY - Continue normal releases               │
│                                                              │
│  Burn Rate:                                                  │
│  ├── This week: 0.6 minutes/day                             │
│  ├── Last week: 1.2 minutes/day                             │
│  └── Trend: IMPROVING ↓                                      │
│                                                              │
└─────────────────────────────────────────────────────────────┘
Alert Fatigue: The Hidden Productivity Killer
Here’s a problem most PMs don’t know about: alert fatigue.
The Scenario
Your engineering team gets 47 alerts per day. Most are noise—false positives, low-priority issues, things that self-resolve. But they don’t know which are real, so they investigate every one.
The result:
- Engineers spend 2-3 hours/day on alert investigation
- Real incidents get slower response (buried in noise)
- Team burns out from constant interruptions
- Nobody trusts the alerts anymore
The Solution: Alert Tiers
Work with engineering to implement alert tiers:
| Tier | Response Time | Example | Notification |
|---|---|---|---|
| P1 - Critical | Immediate | Site down, payment failures | Page on-call, wake up team |
| P2 - High | <30 minutes | Error rate > 5%, latency > 5s | Slack alert, don’t page |
| P3 - Medium | Next business day | Single user error, minor bugs | Email digest |
| P4 - Low | Weekly review | Optimization opportunities | Dashboard only |
The goal: Reduce noise so real problems get immediate attention.
What PMs Should Ask
- “How many alerts does the team get per day?”
- “What percentage are false positives?”
- “How long does it take to respond to critical vs non-critical?”
- “Do we have alert tiers defined?”
If the answer to any of these is “I don’t know” or “too many,” there’s work to do.
Making Product Decisions with Production Data
Monitoring isn’t just for emergencies. It’s a product decision tool.
Use Case 1: Feature Rollout Decisions
Scenario: You’ve released a feature to 25% of users. Should you expand?
Data-driven approach:
Check before expanding:
├── Error rate: Is it <1%?
├── Latency: Is P95 <500ms?
├── User behavior: Are people using the feature?
├── Conversion: Did it improve or hurt?
└── Support tickets: Any increase?

If all green → Expand to 50%
If any red → Investigate before expanding
Use Case 2: Deprecation Decisions
Scenario: You want to remove an old feature. Is anyone still using it?
Data-driven approach:
Check before deprecating:
├── Usage metrics: How many users still access it?
├── API calls: Is the endpoint still being hit?
├── Support tickets: Any questions about the feature?
└── Revenue: Does it drive any business value?

If usage < 1% → Plan deprecation
If usage > 5% → Communicate before removing
Use Case 3: Performance Investment
Scenario: Engineering wants to spend 2 weeks on performance optimization. Is it worth it?
Data-driven approach:
Check before approving:
├── Current latency: What's P95? P99?
├── User impact: How many users are affected by slowness?
├── Business impact: Is conversion lower for slow requests?
├── Baseline: What did latency used to be?
└── Expected improvement: What will latency be after?

If P95 > 1s for >10% of users → Likely worth investment
If P95 < 300ms for everyone → Probably not worth it
Questions to Ask Your Engineering Team
Here’s your conversation starter pack:
About Current Monitoring
- “What’s our availability SLO, and are we meeting it?”
- “How long does it take us to detect a production problem?”
- “How do we know when users are experiencing issues?”
- “What’s our top reliability problem right now?”
About New Features
- “What metrics should we track for this feature?”
- “How will we know if the feature is working correctly?”
- “What alerts should we set up before launch?”
- “How will we measure user impact if something goes wrong?”
About Incidents
- “What’s our mean time to detect (MTTD)?”
- “What’s our mean time to resolve (MTTR)?”
- “Do we do post-mortems after incidents?”
- “What’s our biggest recurring issue?”
The Business Case for Observability Investment
Engineering teams often struggle to get budget for observability tools. Here’s how to make the business case:
The Cost of Blindness
Calculate your cost of downtime:
Revenue per hour: $10,000
Average downtime per month: 2 hours
Revenue lost: $20,000/month = $240,000/year

Add:
├── Engineering overtime: $50,000/year
├── Customer churn from incidents: $100,000/year
├── Support ticket costs: $30,000/year
└── Total cost of poor reliability: $420,000/year
The ROI of Observability
Calculate the improvement:
Observability tool cost: $50,000/year
Expected improvement:
├── 50% faster incident detection (2 hours → 1 hour)
├── 50% faster resolution (2 hours → 1 hour)
├── Fewer incidents due to early detection
└── Estimated savings: $200,000/year

ROI: ($200,000 - $50,000) / $50,000 = 300%
The Executive Pitch
One-slide summary:
“We’re losing $420,000/year to reliability issues. A $50,000 investment in observability will save $200,000/year. That’s a 300% ROI. We’ll detect problems faster, resolve them quicker, and prevent customer-facing incidents.”
Getting Started: The PM’s Observability Checklist
Week 1: Assessment
- Get access to your team’s monitoring dashboards
- Understand your current SLOs
- Review the last 3 months of incidents
- Identify your top 3 reliability concerns
Week 2: Integration
- Add monitoring review to your weekly routine (15 min)
- Request a “feature performance” dashboard
- Understand your team’s alert process
- Document what metrics matter for your product
Week 3: Action
- Set up alerts for critical metrics (if not exists)
- Review error budget with engineering lead
- Identify one feature that needs better monitoring
- Create a plan to improve it
Week 4: Optimization
- Evaluate alert fatigue (how many alerts/day?)
- Propose alert tier system if not exists
- Add business metrics to technical dashboards
- Schedule monthly reliability review with stakeholders
Common Mistakes and How to Avoid Them
Mistake 1: Vanity Metrics
The problem: Tracking metrics that look good but don’t matter.
Example: “We have 99.99% availability!” But the 0.01% downtime was during peak hours and cost $50,000.
The fix: Focus on metrics that matter to users and business. Ask: “If this metric changed, would I change my decisions?”
Mistake 2: Alerting on Everything
The problem: Setting up alerts for every possible metric, creating noise.
The result: Engineers ignore alerts, real problems get missed.
The fix: Alert on symptoms, not causes. Alert on user impact, not system internals.
Mistake 3: Dashboard Overload
The problem: Creating 50 dashboards, nobody knows which to look at.
The result: Important information buried in noise.
The fix: One executive dashboard. One feature dashboard. One error budget dashboard. Keep it simple.
Mistake 4: Ignoring the Data
The problem: Having monitoring but not using it for decisions.
Example: Data shows feature has 5% error rate, but PM ships it to 100% anyway.
The fix: Make monitoring data part of your decision criteria. “No ship without checking the numbers.”
The Bottom Line
Monitoring and observability aren’t just engineering concerns. They’re product concerns.
Without observability, you’re:
- Flying blind on feature performance
- Reacting to problems instead of preventing them
- Making decisions without data
- Surprised by user pain
With observability, you:
- Know what’s working and what isn’t
- Detect problems before users complain
- Make data-driven rollout decisions
- Build credibility with engineering and stakeholders
The shift from “I hope it works” to “I know it works” is transformational. It changes how you ship features, how you communicate with stakeholders, and how you sleep at night.
Your action item this week: Get access to your team’s monitoring dashboards. Spend 15 minutes a day reviewing them. Start asking questions about what you see.
The data is there. You just need to look at it.
What’s your biggest blind spot right now? What would you do if you could see everything happening in production?
Related Reading:
💬 Join the Conversation